expr <- read.table("rs8067378_ENSG00000172057.6.txt")
head(expr)
sample geno exp
1 HG00367 A/G 28.96038
2 NA20768 A/G 20.24449
3 HG00361 A/A 31.32628
4 HG00135 A/A 34.11169
5 NA18870 G/G 18.25141
6 NA11993 A/A 32.89721This class introduces the fundamentals of genome informatics and high throughput sequencing. The lab itself focuses on the Galaxy platform and RNA-Sequencing methods for gene expression analysis.
One sample is obviously not enough to know what is happening in a population. You are interested in assessing genetic differences on a population scale. So, you processed about ~230 samples and did the normalization on a genome level. Now, you want to find whether there is any association of the 4 asthma-associated SNPs (rs8067378…) on ORMDL3 expression.
Q13: Read this file into R and determine the sample size for each genotype and their corresponding median expression levels for each of these genotypes.
expr <- read.table("rs8067378_ENSG00000172057.6.txt")
head(expr) sample geno exp
1 HG00367 A/G 28.96038
2 NA20768 A/G 20.24449
3 HG00361 A/A 31.32628
4 HG00135 A/A 34.11169
5 NA18870 G/G 18.25141
6 NA11993 A/A 32.89721The sample size for each genotype is here below:
table(expr$geno)
A/A A/G G/G
108 233 121
The median expression levels for each of the genotypes are here below:
summary(expr$exp[expr$geno == "A/A"]) Min. 1st Qu. Median Mean 3rd Qu. Max.
11.40 27.02 31.25 31.82 35.92 51.52 summary(expr$exp[expr$geno == "A/G"]) Min. 1st Qu. Median Mean 3rd Qu. Max.
7.075 20.626 25.065 25.397 30.552 48.034 summary(expr$exp[expr$geno == "G/G"]) Min. 1st Qu. Median Mean 3rd Qu. Max.
6.675 16.903 20.074 20.594 24.457 33.956 bp <- boxplot(exp ~ geno, expr)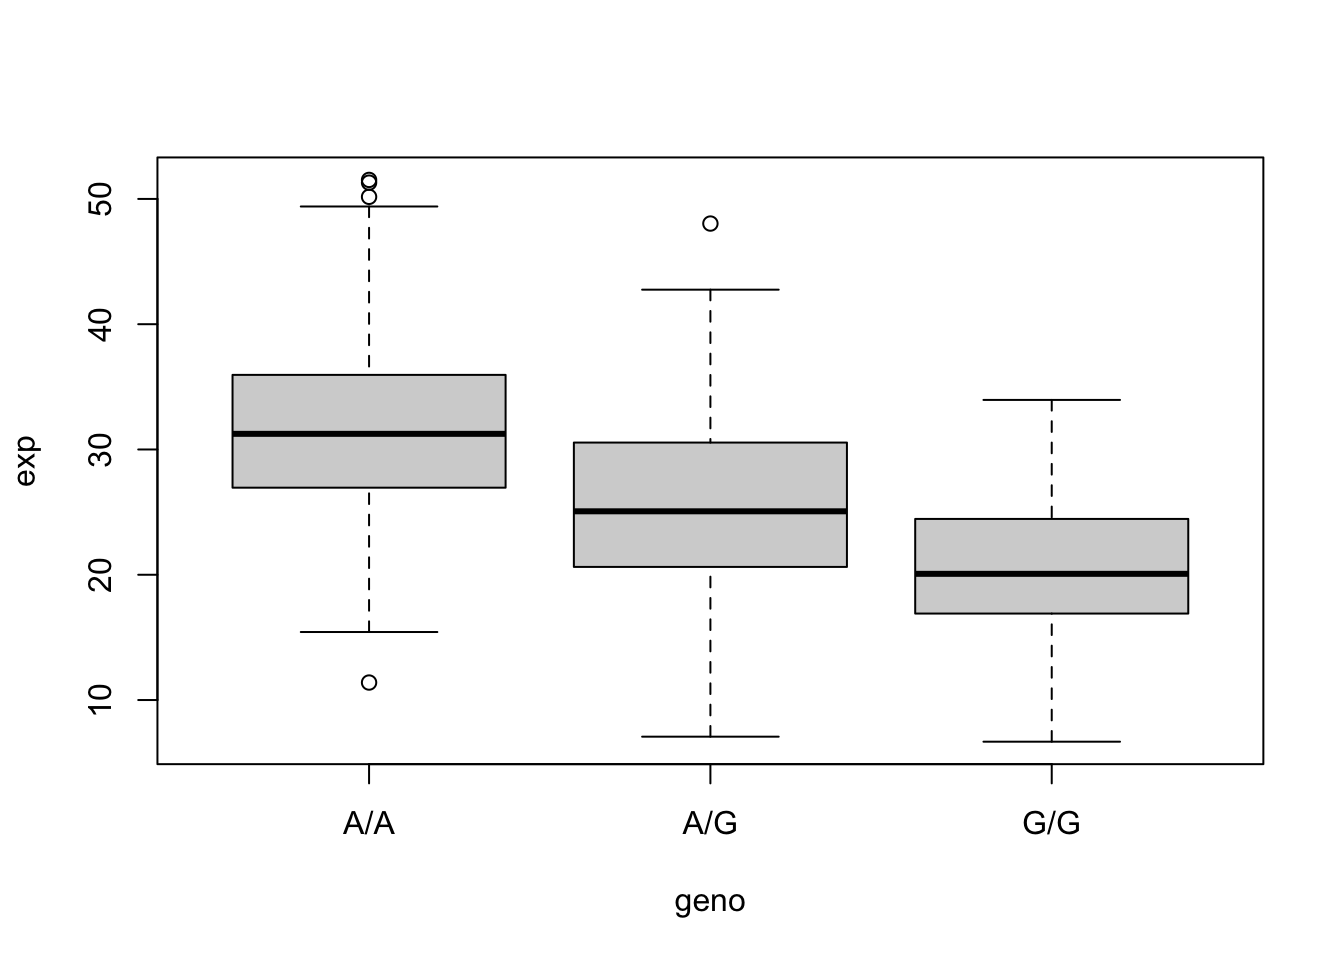
bp$stats[3,][1] 31.24847 25.06486 20.07363A/A = 31.24847, A/G = 25.06486, G/G = 20.07363
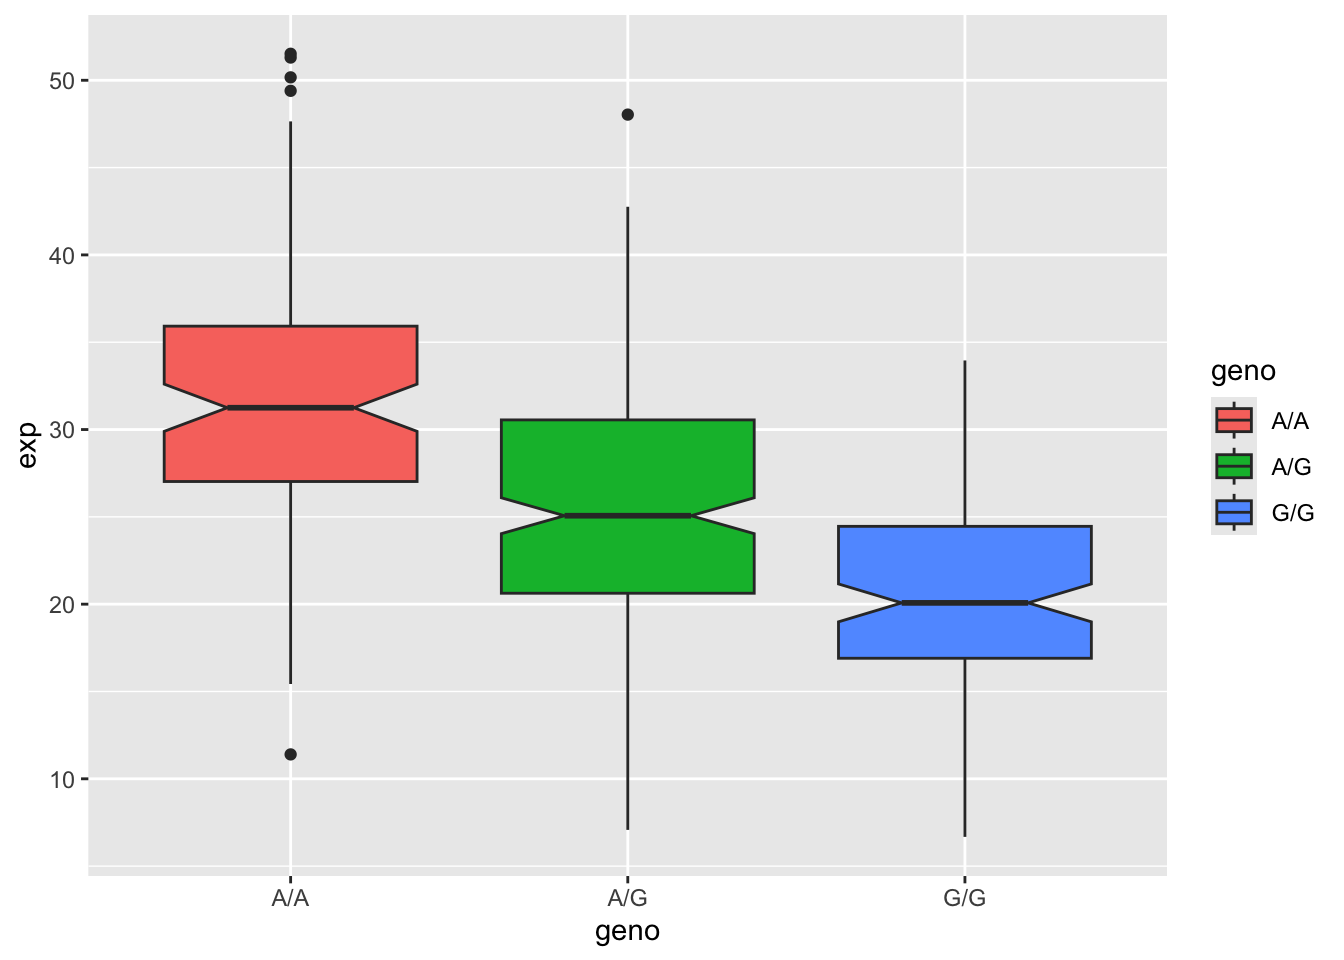
Q14: Generate a boxplot with a box per genotype, what could you infer from the relative expression value between A/A and G/G displayed in this plot? Does the SNP affect the expression of ORMDL3?
It can be inferred that the relative expression value between A/A and G/G are quite different, with G/G being having a reduced relative expression level compared to A/A. Therefore, it can be inferred that the SNP does affect the expression of ORMDL3 based on this boxplot.
library(ggplot2)
ggplot(expr) + aes(geno, exp, fill = geno) + geom_boxplot(notch = TRUE)